


글로벌 연구동향
핵의학


![[Sci Rep .] Comparative analysis of batch correction methods for FDG PET/CT using metabolic radiogenomic data of lung cancer patients](/enewspaper/upimages/1702453090admin.JPG) [Sci Rep .] Comparative analysis of batch correction methods for FDG PET/CT using metabolic radiogenomic data of lung cancer patients
[Sci Rep .] Comparative analysis of batch correction methods for FDG PET/CT using metabolic radiogenomic data of lung cancer patients성균관의대 / 이현종, 서수진,문승환*
- 출처
- Sci Rep .
- 등재일
- 2023 Oct 25
- 저널이슈번호
- 13(1):18247. doi: 10.1038/s41598-023-45296-9.
- 내용
Abstract
In radiomics research, the issue of different instruments being used is significant. In this study, we compared three correction methods to reduce the batch effects in radiogenomic data from fluorodeoxyglucose (FDG) PET/CT images of lung cancer patients. Texture features of the FDG PET/CT images and genomic data were retrospectively obtained. The features were corrected with different methods: phantom correction, ComBat method, and Limma method. Batch effects were estimated using three analytic tools: principal component analysis (PCA), the k-nearest neighbor batch effect test (kBET), and the silhouette score. Finally, the associations of features and gene mutations were compared between each correction method. Although the kBET rejection rate and silhouette score were lower in the phantom-corrected data than in the uncorrected data, a PCA plot showed a similar variance. ComBat and Limma methods provided correction with low batch effects, and there was no significant difference in the results of the two methods. In ComBat- and Limma-corrected data, more texture features exhibited a significant association with the TP53 mutation than in those in the phantom-corrected data. This study suggests that correction with ComBat or Limma methods can be more effective or equally as effective as the phantom method in reducing batch effects.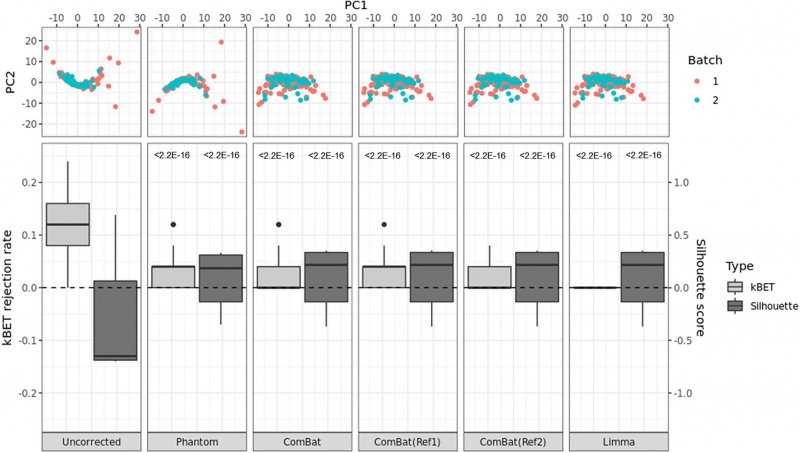
Figure 1. PCA plots (top) and box plots of kBET rejection rates and silhouette scores (bottom) by each batch correction method. The p-values from the t-test compared with uncorrected data are noted in the top of each box plot.
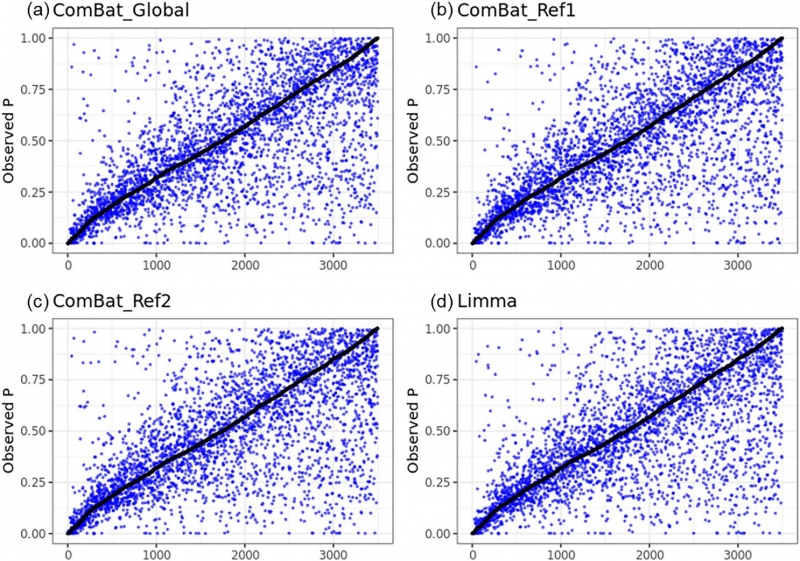
Figure 2. Plots of p-values of logistic regression for (a) ComBat (Global), (b) ComBat (Reference 1), (c)
ComBat (Reference 2), and (d) Limma versus p-values for the phantom method (black dots in each box plot.
Affiliations
Hyunjong Lee # 1, Sujin Seo # 2, Sungho Won 2, Woong-Yang Park 3, Joon Young Choi 1, Kyung-Han Lee 1, Se-Hoon Lee 4, Seung Hwan Moon 5
1Department of Nuclear Medicine, Samsung Medical Center, Sungkyunkwan University School of Medicine, 81 Irwon-ro, Gangnam-gu, Seoul, 06351, Republic of Korea.
2Department of Public Health Science, Graduate School of Public Health, Seoul National University, Gwanak_1 Gwanak-ro, Gwanak-gu, Seoul, 08826, Republic of Korea.
3Department of Molecular Cell Biology, Samsung Medical Center, Samsung Genome Institute, Samsung Advanced Institute of Health Science and Technology, Sungkyunkwan University School of Medicine, Seoul, Republic of Korea.
4Division of Hematology/Oncology, Department of Medicine, Samsung Medical Center, Sungkyunkwan University School of Medicine, Seoul, Republic of Korea.
5Department of Nuclear Medicine, Samsung Medical Center, Sungkyunkwan University School of Medicine, 81 Irwon-ro, Gangnam-gu, Seoul, 06351, Republic of Korea. seunghwan.moons.moon@samsung.com.
#Contributed equally.
- 연구소개
- Radiomics는 각광받는 영상연구 분야 중 하나이나 서로 다른 scanner & protocol에서 얻어진 영상에서 radiomic feature를 얻었을 경우 batch effect로 인해 올바른 결과를 도출하기 어려울 수 있습니다. 이를 극복하기 위하여 보정방법들이 적용되고 있으나 아직 관련된 이슈가 정리되지 않았으며 특히 radiomic feature와 gene data를 결합시키는 radiogenomics에서는 관련 연구가 거의 없는 상황입니다. 이 연구는 여러 보정기법들을 비교분석한 것으로 다기관 radiomic 연구를 기획하시는 연구자들에게 도움이 될 만한 정보라고 생각합니다.
- 덧글달기
- 이전글 [Cancer Imaging .] Semi-quantitative FDG parameters predict survival in multiple myeloma patients without autologous stem cell transplantation
- 다음글 [Sci Rep .] CT-based measurement of visceral adipose tissue volume as a reliable tool for assessing metabolic risk factors in prediabetes across subtypes


![]()
- COPYRIGHT(C) 2015 한국원자력의학원 전략기획팀 All rights Reserved.
- 문의 : rmwebzine@kirams.re.kr 발행처 : 한국원자력의학원 전략기획팀
- 우) 01812 서울시 노원구 노원로 75 한국원자력의학원 전략기획팀